Introduction: The Transition Is Real, but Uneven
Starting university in London, and later at my master’s, climate change was central. The Paris Agreement had just been signed, the Sustainable Development Goals were new, and at Imperial, guest lecturers echoed the same themes: how quickly could we move, which technologies would matter, what policies would direct capital, and how would the world change in ten years?
Ten years later, I find myself wanting to answer that question properly. Where are we, actually?
The energy transition is well underway, and in some areas it has moved faster than even the optimists of 2015 expected. Overall, though, we are behind, and the gap between what was promised and what has been delivered is the subject of this article: where the transition has overdelivered, where it has fallen short, and why.
There are many reports about this topic. The IEA publishes a small library of them every year (1), as do IRENA, the IPCC, UNEP, BloombergNEF, Ember, and the Global Carbon Project. Each one is excellent, and each one reads like it was written for someone who already lives inside the topic.
I wanted to do something different: step back from the individual reports, compare our 2015 expectations with what actually happened, and clarify both our progress and failures. Most of all, I wanted to see where we stand now.
The Promises Made in 2015 and 2016
To judge where we are, we have to be honest about where we said we wanted to go.
The Paris Agreement, signed in December 2015 and entered into force in November 2016, was the headline commitment: hold global average warming to well below 2°C above pre-industrial levels, pursue efforts to limit it to 1.5°C, reach a peak in global emissions as soon as possible, and achieve net zero in the second half of the century. The mechanism was the Nationally Determined Contributions: country-level pledges that would, in theory, ratchet up over time.
In the same period, the United Nations adopted Sustainable Development Goal 7, which called for universal access to affordable, reliable, sustainable, and modern energy by 2030. In practice, that meant universal electricity access, universal clean cooking, a substantial increase in the renewables share of the global energy mix, and a doubling of the rate of energy efficiency improvement.
The IEA later turned those broad ambitions into something more concrete. Its 2017 Sustainable Development Scenario, and especially its 2021 Net Zero by 2050 roadmap, translated climate targets into milestones: build solar and wind at extraordinary speed, push coal into decline, cut methane from fossil fuel operations by 75% by 2030, stop selling new internal-combustion cars by 2035, and rapidly scale heat pumps.
There were financial promises too: the $100 billion per year in climate finance from rich countries to developing ones, first pledged in Copenhagen in 2009 and reaffirmed throughout the Paris era, alongside the Just Energy Transition Partnerships that emerged from COP26 and the Loss and Damage Fund agreed in principle at COP27.
The world did not freeze its ambitions in 2015. Paris was designed to be updated. But 2015 and 2016 still matter as a starting line: the moment the world publicly said what it was trying to do.
The Scoreboard: Where We Stand Today
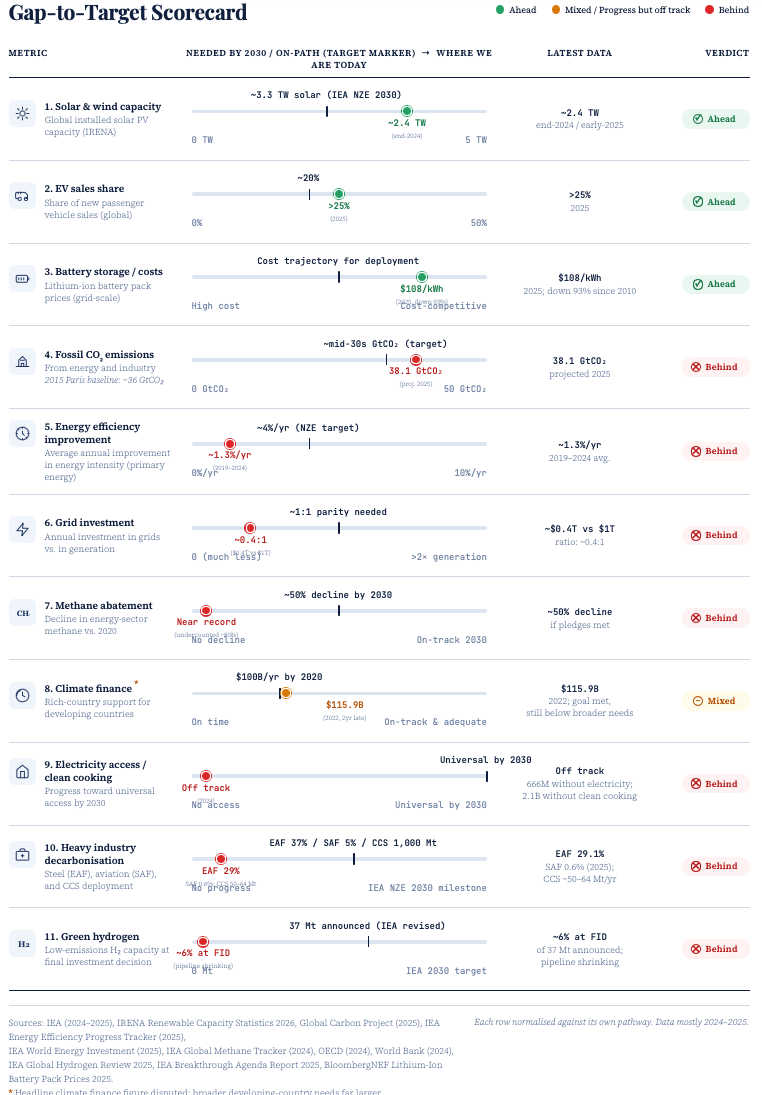
This table compares where the energy transition was expected to be after the Paris Agreement with where things stand today. It draws on several major benchmarks, including the IEA Net Zero by 2050 roadmap, SDG7, the Global Methane Pledge, and subsequent COP commitments. The sections below walk through the evidence on both sides.
Reading the Scoreboard: What It Actually Tells Us
To me, the scoreboard makes one thing clear: while the world has achieved remarkable progress in certain aspects of the energy transition, it is still falling short overall. This is the core lesson of the decade: the world has been much better at scaling clean technologies than at replacing the fossil system around them.
The Technologies That Beat Every Forecast
Solar photovoltaics is the clearest example of overdelivery against predictions. Installed global solar capacity grew from around 227 GW at the end of 2015 to roughly 2,392 GW at the end of 2025, a tenfold increase (8). The IEA’s 2015 New Policies scenario had projected approximately 600 GW of solar by 2030; the world hit four times that number five years early. (1) In 2025 alone, solar added 511 GW, probably the largest single-year addition ever recorded for any electricity-generating technology.
The explanation is not mysterious: costs collapsed. The global weighted-average levelised cost of utility-scale solar fell from about $0.13/kWh in 2015 to $0.043/kWh in 2024 (9). At those prices, solar is no longer a marginal green technology; in many markets it is simply one of the cheapest ways to add bulk electricity. Onshore wind followed a similar path, with global LCOE falling to around $0.034/kWh (9). Batteries changed the economics too, with lithium-ion pack prices dropping from around $1,400/kWh in 2010 to $108/kWh in 2025 (11).
Electric vehicles show the same pattern, although the geography is different. Global EV sales share rose from under 1% in 2015 to more than 25% in 2025, or over 20 million cars sold (3). China is the centre of that story: new energy vehicles reached around 60% of new car sales there. Europe was closer to 25%. The United States, by contrast, remained nearer 11%. (3)
The result is now visible in the electricity numbers themselves. In 2025, clean generation rose by 887 terawatt hours globally against demand growth of 849 terawatt hours, meaning that for the first time in modern history, fossil generation actually fell 0.2% even as electricity demand grew (10). That matters because it was not a crisis-driven fall like 2009 or 2020; it was a small but structural signal that clean power growth had, for once, exceeded growth in electricity demand. Renewables overtook coal in the global electricity mix, and the European Union saw wind and solar combined exceed fossil generation in 2025. Overall, it is striking and motivating to see these numbers 10 years later.
The Areas That Fell Behind
Step outside the electricity sector and the picture changes. In this section, we understand what the scoreboard is telling us. Let’s look at the main areas.
Energy efficiency: efficiency has badly underdelivered. Global primary energy intensity improved at roughly 1.3% per year over 2019 to 2024, slower than the 2.0% pace of the 2010s and far below the 4% per year goal agreed at COP28 in 2023 (5).
Grids: The grid is now one of the binding constraints of the transition. Global grid investment was roughly 400 billion dollars in 2025, compared with more than 1 trillion dollars in generation, and around 1,650 GW of solar and wind was already in advanced stages awaiting connection at the end of 2024 (2). The US interconnection queue alone holds approximately 2,300 GW. (24) China is now seeing the other side of the same problem: solar curtailment reached 6.6% and wind curtailment 5.7% in the first half of 2025, with Tibet curtailing 30.2% of wind and 33.9% of solar in H1 2025. (10) The world can now build cheap renewable generation faster than it can connect, move, and use it.
Heat pumps: Heat pumps lost momentum in 2024, with global sales falling roughly 1% and the European market dropping 21%, including a 50% fall in Germany after subsidy cuts, although the installed stock continued to grow as previous years’ deployments accumulated. (5) That matters because heat pumps are one of the few mature options for decarbonising building heat, and the IEA’s tripling-by-2030 target now looks increasingly out of reach.
Hard-to-abate sectors: Progress is thin. Steel’s share of electric arc furnace production rose to 29.1% in 2024 (18), against an IEA target of 37% by 2030, while near-zero emissions iron capacity for 2030 is stuck around 10 million tonnes, perhaps ten times too small (19). Cement is essentially flat. Sustainable aviation fuel reached just 0.6% of global jet fuel in 2025, against an ICAO 2030 goal of a 5% reduction in aviation carbon intensity through SAF. (1) Operational CCS capacity worldwide stands at around 50 million tonnes (at end-2024/early-2025, rising to 64 Mtpa by July/late 2025) per year against the roughly 1,000 million tonnes per year needed for net zero alignment (1).
Green hydrogen: The hydrogen story has changed sharply in the past two years. It is no longer just a question of slow deployment; the project pipeline is now shrinking. The IEA’s 2025 review cut announced 2030 low-emissions hydrogen production capacity from 49 million tonnes to 37 million tonnes, with only around 6% of announced production having reached final investment decision (7).
Methane: Despite pledging a 30% cut by 2030, fossil-fuel methane emissions in 2024 still topped 120 million tonnes, nearly hitting the record set in 2019. Even worse, official country reports are underestimating actual measured emissions by about 80%. (6) We don’t lack the technology to fix this; we lack the measurement, enforcement, structure and political will.
Climate finance and energy access: Both remain well short of need. The 100 billion dollars per year promised by 2020 was only hit in 2022, the Loss and Damage Fund has attracted around 768 million in pledges against estimated needs of more than 400 billion per year, and 666 million people still lacked electricity in 2023, while 2.1 billion lacked clean cooking (4). It is important to always remember that for much of the world, the transition is not only about replacing fossil fuels. It is about getting access to modern energy in the first place.
There Is No Single Global Transition
While the article mainly looks at energy transition as a whole, it is still important to look at the different regions of the world. The decade has not played out evenly across the world, and if anything, it has produced a geopolitical split. The matrix below sketches the broad picture.
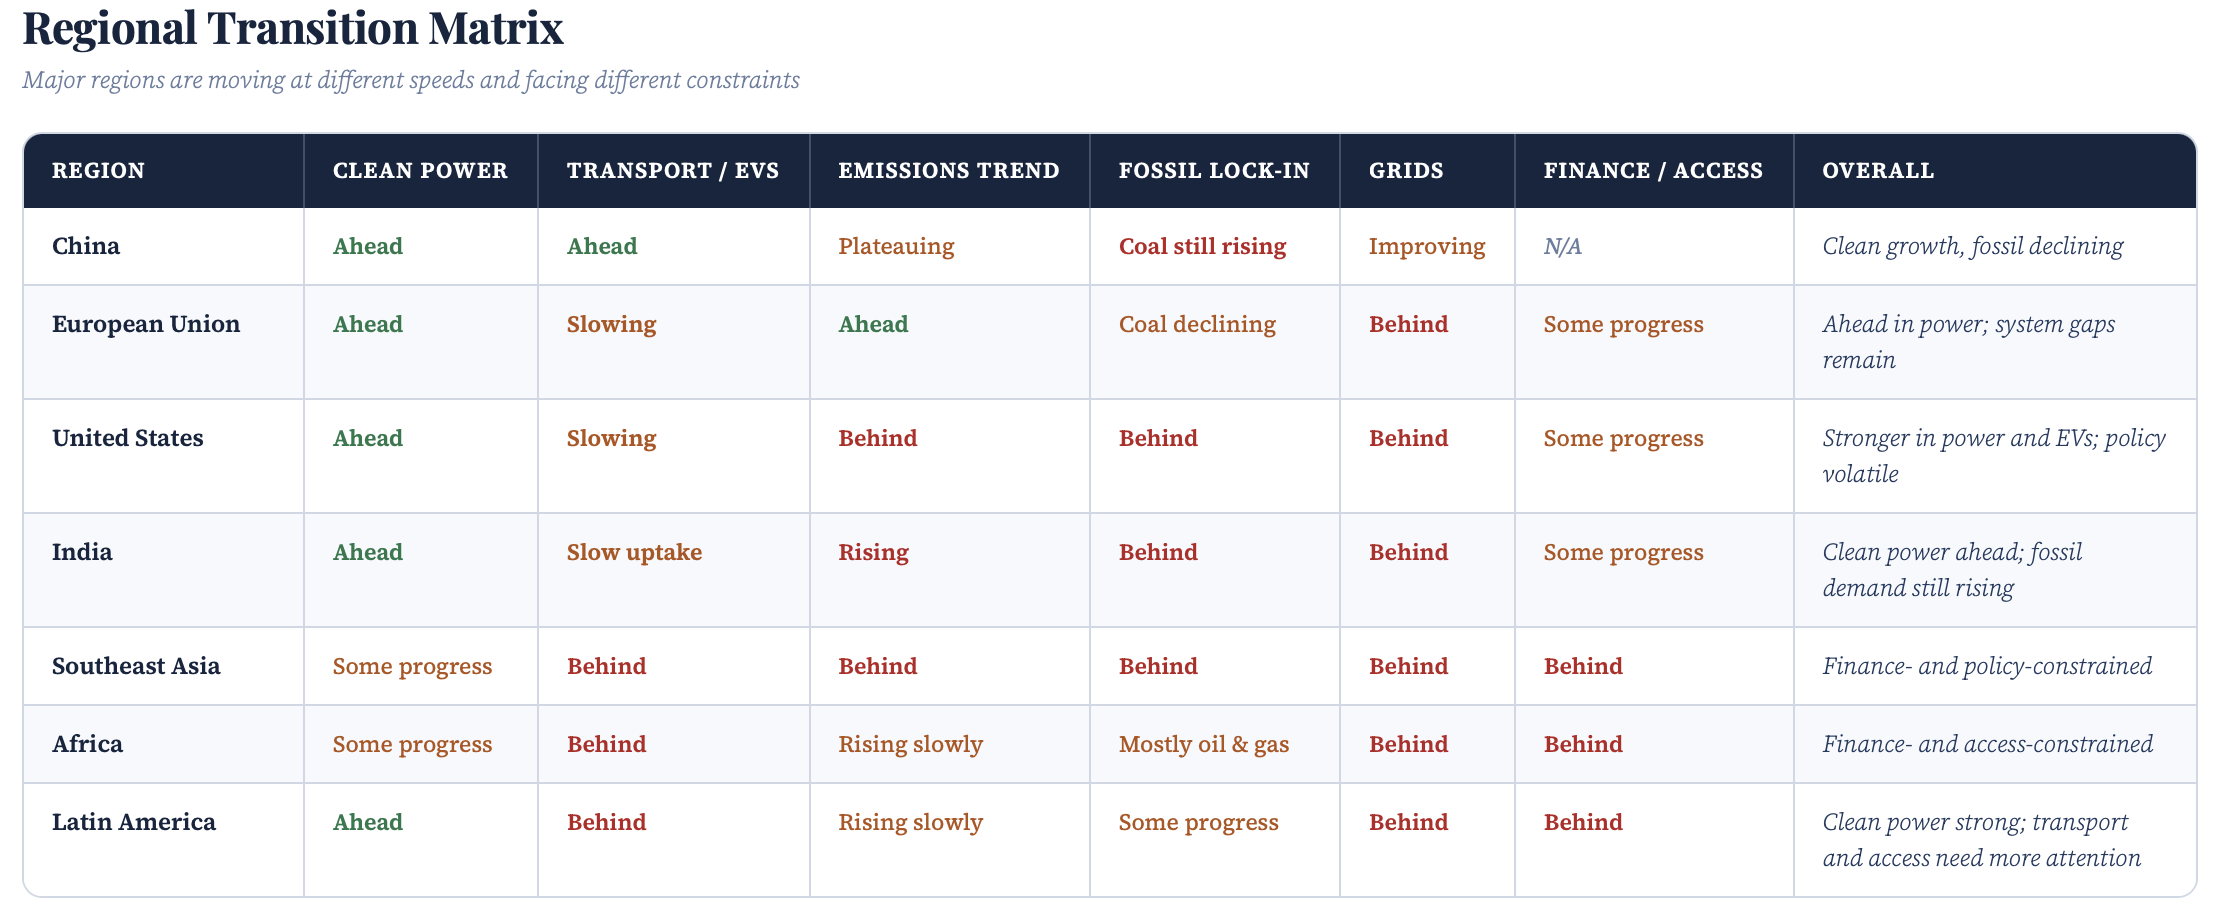
Table 1. Regional transition matrix. The Overall column summarizes each region’s particular shape of progress and constraint, rather than ranking them on a single scale.
China is the single largest reason the breakthroughs have happened. In 2025 alone, it added around 315 GW of solar and 119 GW of wind (according to figures attributed to China’s National Energy Administration), and now hosts more than half of the world’s installed solar, wind, EV manufacturing, and battery production (8). Cleantech was around 10% of Chinese GDP in 2024. (10) Chinese CO₂ emissions have been flat or falling for 21 months as of late 2025. (10)
The European Union is roughly on track for its 55% by 2030 emissions target, having reached around 37% below 1990 levels by 2024. (16) In March 2026, it adopted a 90% by 2040 target, 85% domestic plus up to 5% international carbon credits, and the buildings and transport ETS2 has been delayed to 2028. (27, 28) EU wind and solar combined exceeded fossil generation for the first calendar year in 2025.
India is the most interesting case. It is overdelivering on renewables capacity, hitting its 50% non-fossil capacity target five years ahead of schedule, while simultaneously expanding coal at scale, with 38 GW of new coal capacity proposed in 2024, the highest annual total on record. (23) The Indian transition is genuinely happening, but on top of, rather than instead of, the existing fossil system.
The United States has effectively abandoned its 50 to 52% by 2030 target. The Trump administration’s “One Big Beautiful Bill Act” sunsetted solar and wind tax credits and froze offshore wind leasing, leading to approximately 6.9 billion dollars of clean tech project cancellations. US emissions rose roughly 2.4% in 2025, and the country’s withdrawal from the Paris Agreement became effective on 27 January 2026. (26)
Then there’s everywhere else, which is most of the world, and gets the least attention. Southeast Asia, Africa, and Latin America each face a different version of the same problem: a transition that is technically possible and financially out of reach. African countries face the world’s highest cost of capital for clean projects. Latin America has some of the cleanest electricity systems in the world, thanks to hydro, but limited fiscal space to electrify transport, heat, and industry on top of it.
Why the Gap Exists
If the question is why we are not on track, the answer is not technological. The technology that the world needs has, by and large, arrived. Part of the explanation sits beyond the scope of this article: the events of the last five years, COVID, a new era of war, rising defence budgets, increasing geopolitical tension, have pulled political attention and public spending away from the energy transition in ways that are hard to quantify but easy to feel. Before 2020, climate and net zero sat near the top of most policy agendas; today, in many governments, it is a third or fourth priority at best.
Setting politics and policy aside (and it deserves an article of its own), I have listed five main structural reasons to explain why the curve has not bent as far as the promises implied.
Clean energy is being added rapidly, but fossil energy is not being removed fast enough
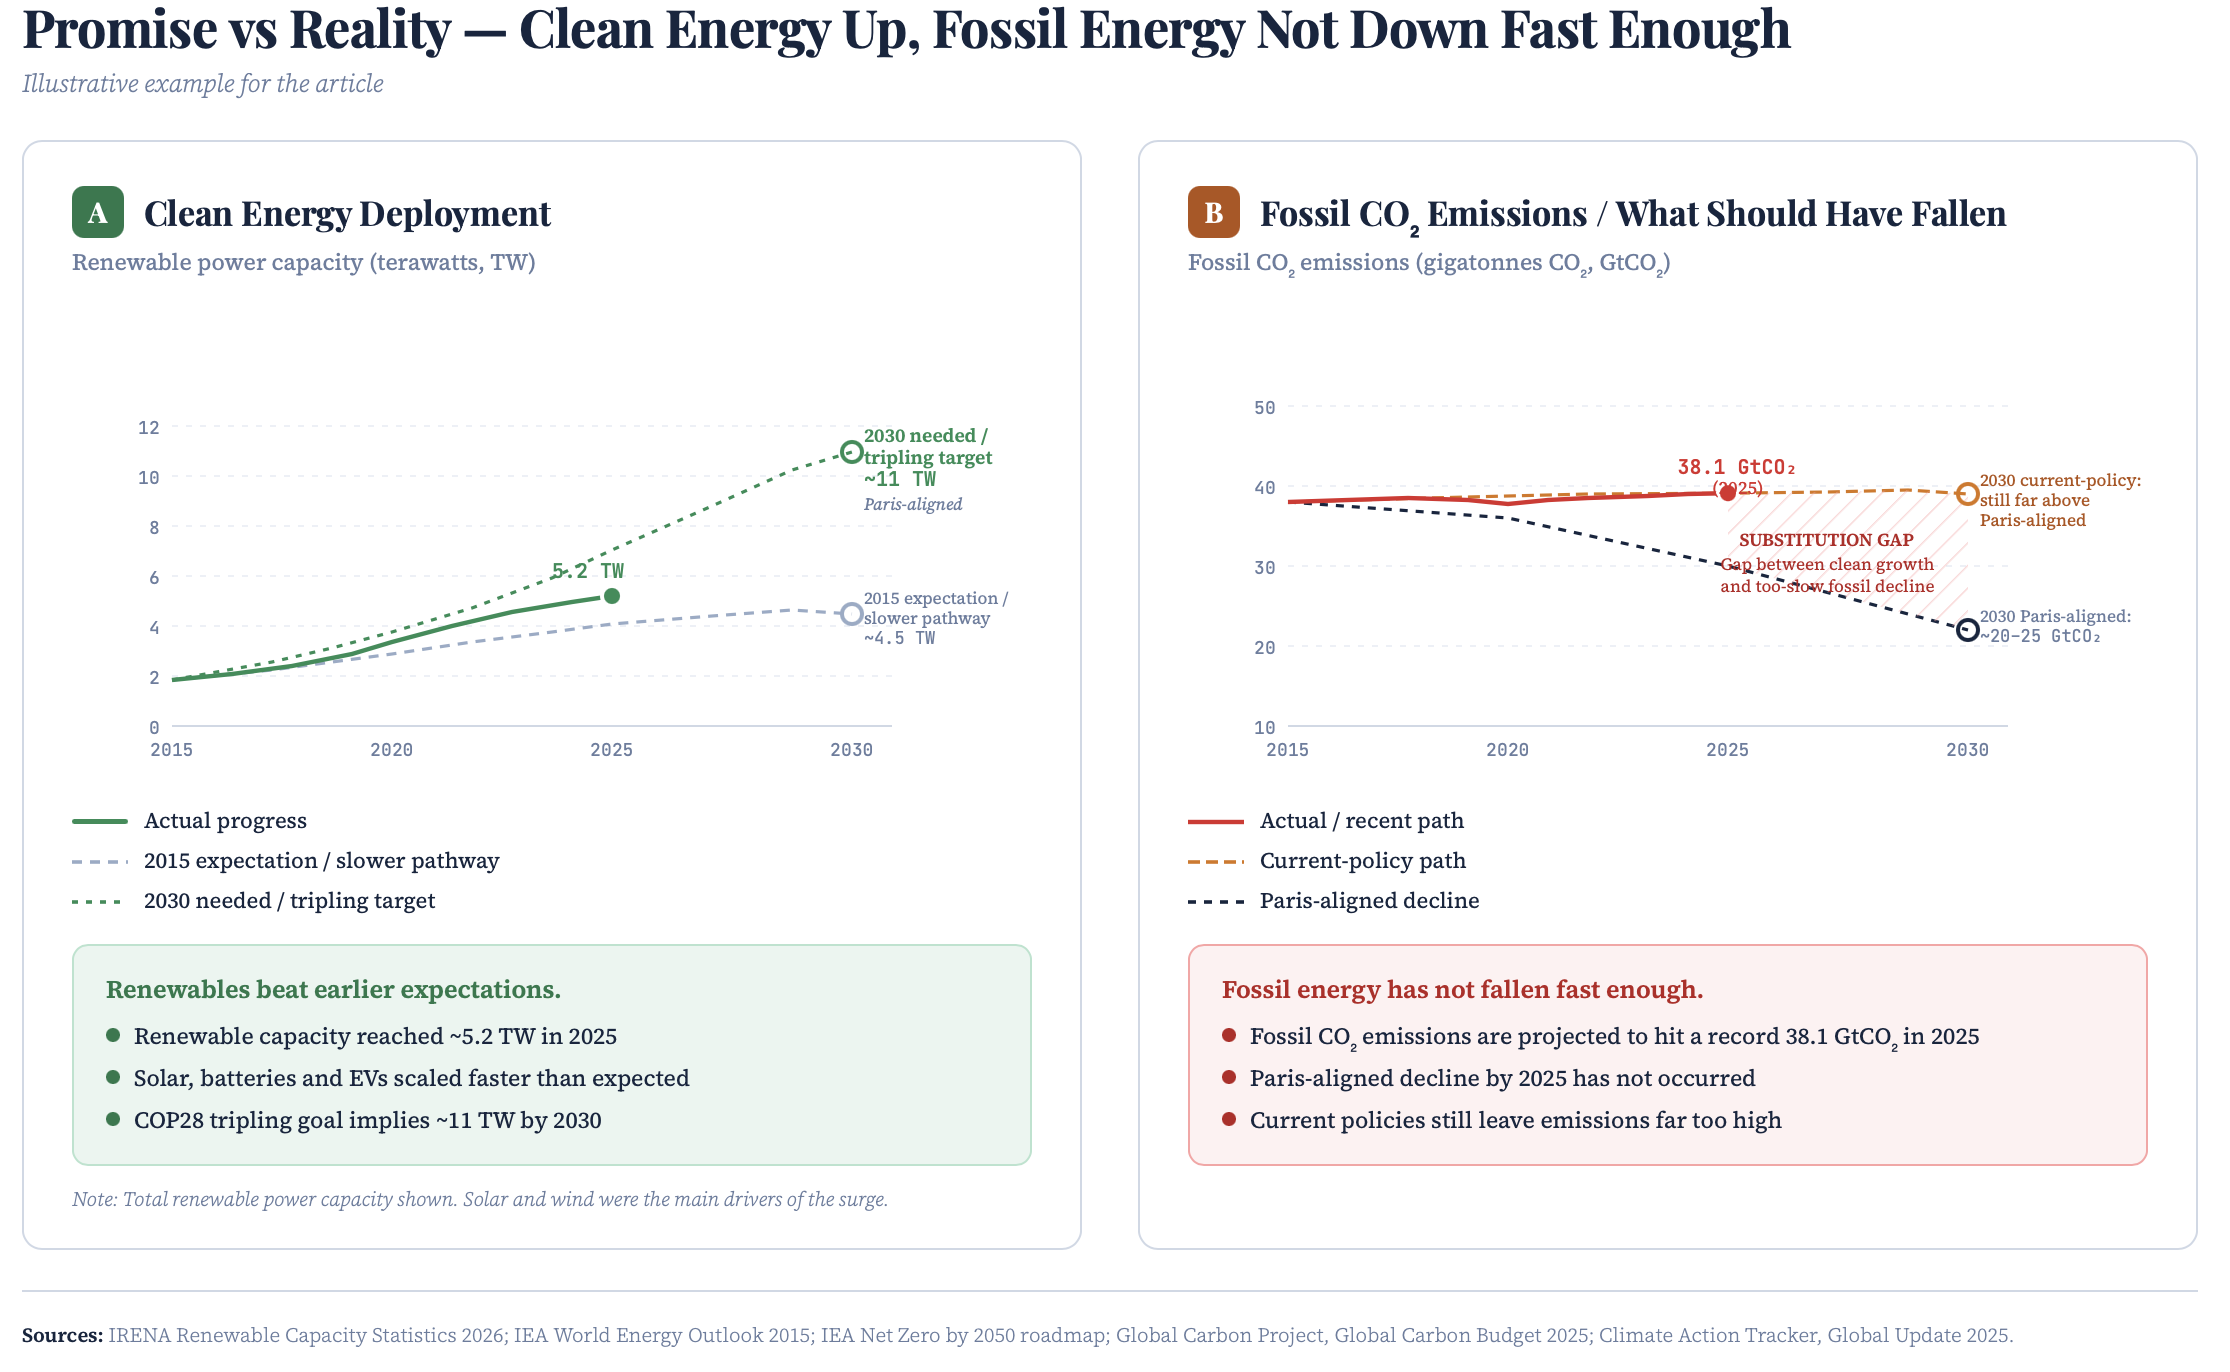
The starkest summary of the decade is a single number: 38.1 gigatonnes of CO₂. That is the projected record level of fossil fuel CO₂ emissions in 2025, up 1.1% on 2024 and up from roughly 36 gigatonnes in 2015, over a decade in which solar capacity grew tenfold, EV sales grew fortyfold, battery costs fell by 93%, and renewables accounted for around 86% of new power-capacity additions in 2025. (12) (25)
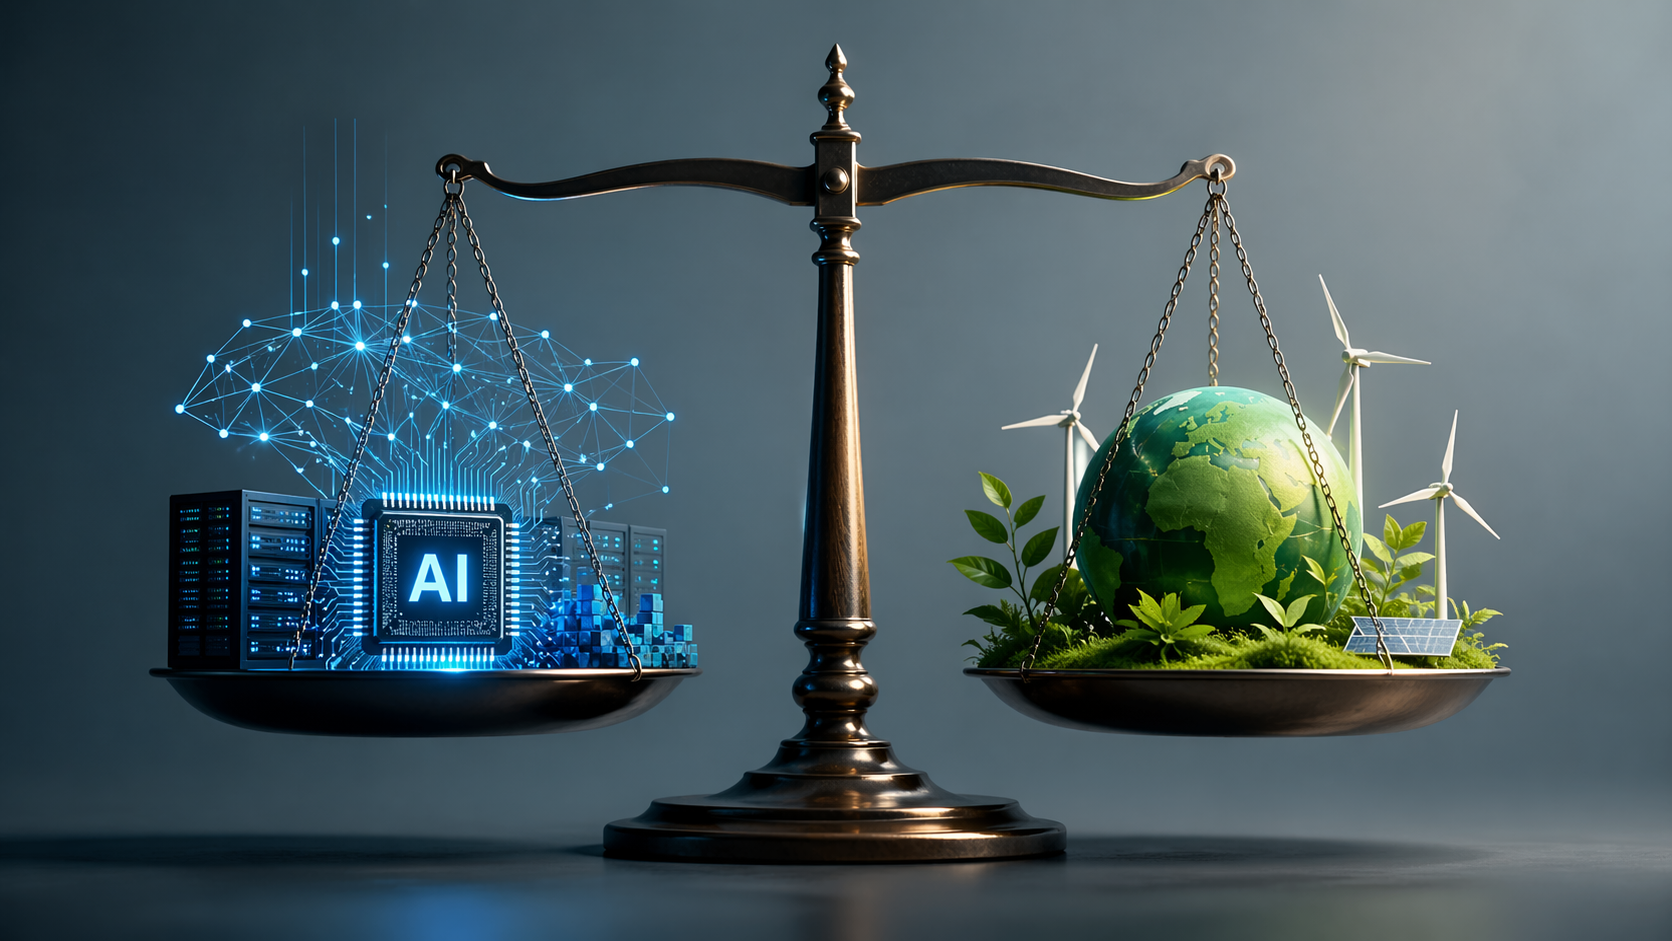
There is nothing contradictory about record clean-energy deployment and record fossil-fuel use. It just means that clean energy is still being added to a growing energy system faster than fossil energy is being removed from it. Introduction of AI and the need for more data centers is a clear example of how you can add both renewables, but also increase emissions. The transition only becomes fully visible in emissions when clean-energy growth does more than meet new demand: it has to displace existing fossil supply. That is the difference between addition and subtraction (16). The electricity sector crossed that line globally in 2025, for the first time. Transport has not. Heat has not. Industry has barely begun.
However, among heavy emitters, coal has been meaningfully displaced in parts of the world, especially advanced economies and the EU power sector, but global coal use remains high and has not entered a clear sustained global decline.
Figure 2 is the simplest way to see the gap. The world has built far more clean energy than expected, but fossil energy has not fallen fast enough, and for climate outcomes the second fact matters as much as the first. Similar work now needs to happen for the other fossil fuels.
Infrastructure moves slower than manufacturing
The next cause is a structural mismatch between what the transition has been good at and what it now needs.
Solar panels, batteries, and EVs are products. They benefit from steep cost curves, global supply chains, and competitive manufacturing. A panel built in Anhui can be shipped to Texas and installed on a roof with relatively little friction, and each generation gets cheaper as each year of deployment teaches the next. That is why these technologies have moved at the pace they have (17). Almost everything else the transition needs is infrastructure: grids, transmission lines, substations, distribution networks, building retrofits, district heat systems, EV chargers. None of these scale through a global supply chain. They are slow, regulated, place-bound, and politically difficult. Adding a transmission line means crossing landowners, utilities, regulators, and political jurisdictions, often in that order.
As aforementioned, the grid infrastructure numbers make the gap concrete and investment has not kept pace. Building more generation without building more wires produces queues, curtailment, and stranded clean megawatts. Storage is starting to absorb some of the slack, but storage is also infrastructure, and it depends on the same grid build-out to be useful.
The same logic applies inside buildings. Heat pumps work as a technology, but they remain significantly more expensive upfront than the gas boilers they replace, and the systems around them, installer networks, retrofit standards, electricity-to-gas price ratios, consumer financing, are not yet in place to close that cost gap at scale. Heat decarbonisation depends on building stock that turns over once every several decades and on decisions made one boiler at a time, which does not lend itself to a manufacturing learning curve.
Manufacturing got cheap because it could. Infrastructure has not, because it is harder, and the next decade of progress depends on building the wires, the substations, the heat networks, and the installer base behind the products that already exist.
Beyond deployment, we need to rethink the systems that energy flows through. In the near term, fossil fuels will likely remain part of the mix, not as a destination, but as a bridge. The real priority is reducing dependence gradually while building the flexibility that makes a higher share of renewables manageable: smarter grids, better storage dispatch, demand response, and the infrastructure investment the previous section describes. Technology alone does not get us there. The harder work is redesigning the systems around it.
Some Technologies That Still Have to Grow Up
Infrastructure and systems are not the whole story. Some technologies still need to travel the same cost curve that solar and batteries have traced over the past decade. Hydrogen is the clearest case: low-emissions production remains expensive, demand is uncertain, supply chains are immature, and the infrastructure requirements are enormous, all at once. Carbon capture, synthetic fuels, long-duration storage, and much of industrial decarbonisation face versions of the same problem: costs still too high, markets too thin, and no clear trigger for the kind of deployment that drives learning.
Hard-to-abate sectors need markets
In heavy industry, aviation, and shipping, the barrier is no longer technology: green steel costs 25–50% more than blast-furnace steel, sustainable aviation fuel runs two to four times the price of fossil jet fuel, and low-carbon cement carries a similar premium, so none of them wins in an unregulated market.
What some of these sectors need is not just another cost curve; they need policy-created markets. That can mean carbon pricing high enough to close the green premium, but in practice it usually means more targeted instruments: carbon contracts for difference that guarantee a green producer a fixed carbon price for long enough to bank a project, green public procurement that requires governments to buy low-carbon steel and cement for public works, mandates and sectoral standards that set a floor on the share of clean fuel in jet engines and ship bunkers, and offtake agreements between large buyers and early producers that de-risk the first plants. Mercedes and Amazon have signed offtakes for green steel. The EU’s Carbon Border Adjustment Mechanism is starting to push the carbon price into imported materials, and the UK and Germany are experimenting with carbon contracts for difference. None of this is at scale yet, but the shape of the policy answer is clearer than it was in 2015.
The lesson from these sectors is that markets do not exist for green molecules until governments, or some other actor, create them. The next decade of hard-to-abate progress depends on whether the policy machinery to create demand can be built faster than the existing fossil infrastructure locks in another generation of emissions.
The finance gap: why the transition is not reaching everyone
The deepest split, however, is not only geopolitical. It is financial. The global South is the part of the transition that gets discussed least and matters most, because the next major wave of energy demand growth will come disproportionately from emerging and developing economies, not from Europe. These are also the countries where energy access is still incomplete, grids are weakest, and the cost of capital is highest. The places where the transition matters most for human development are often the places where it is hardest to finance.
SDG7, the 2015 promise of universal energy access by 2030, will be missed by every measure. As noted above, 666 million people lacked electricity in 2023, the most recent firm number, down from roughly 1.06 billion in 2015, but with the gap flat or rising since 2021 (4). Sub-Saharan Africa now holds 85% of the global access deficit, around 565 million people, and the absolute number has been essentially unchanged since 2010 because population growth keeps pace with new connections; rural Sub-Saharan Africa has 37% access, against 80% urban. (4)
The investment gap is another issue. Africa receives roughly 2% of global clean energy investment despite holding 20% of the world’s population, and total African energy investment in 2025 is one-third lower in real terms than in 2015 (2). Emerging markets and developing economies excluding China need clean energy investment to rise from around 260 to 270 billion dollars today to between 1.4 and 1.9 trillion dollars per year by the early 2030s, roughly seven times current flows. (2) Utility-scale solar in these economies costs two to three times more than in China or advanced economies, almost entirely because of the cost of capital, and 74% of these economies hold sovereign credit ratings of B+ or below (21). This is the harsh reality of the finance gap: the same clean technology can be economically attractive in one country and prohibitively expensive in another, not because the sun shines less or the wind blows less, but because capital is priced differently.
International climate finance, the structure designed to close that gap, has substantially failed. The 100 billion dollars per year promised by 2020 was hit only in 2022, two years late, and the OECD’s accounting of that figure has itself been criticised as inflated by face-value loan accounting. Adaptation finance fell from 28 billion dollars in 2022 to 26 billion in 2023, against a goal of doubling to roughly 40 billion by 2025 (13). The new finance goal agreed at COP29, 300 billion dollars per year by 2035, requires only 7.6% per year growth, slower than the 2013 to 2022 trend. (15) The Loss and Damage Fund has attracted less than $1 billion in pledges against estimated needs exceeding 400 billion dollars per year by 2030, a shortfall of three orders of magnitude, and roughly 430 million dollars has actually been paid in as of late 2025. (15)
Just Energy Transition Partnerships have collectively pledged roughly 45 billion dollars against the needs of 330 billion for South Africa, Indonesia, and Vietnam alone, while coal use in Southeast Asia is forecast to grow 4.5% per year through 2030 (22), and the US withdrew from all JETPs in March 2025. It is hard, and countries are facing their own economic challenges. However, it does not change the fact that promises were not kept.
The bargain offered to the global South in 2015 was that the global North would help finance their leapfrog into clean energy. That bargain has not been kept.
The Verdict: Where Current Trajectories Land
The Paris Agreement set a goal of holding warming well below 2°C with efforts toward 1.5°C. In 2015, prevailing policy projections pointed to roughly 3.6°C of warming by 2100. The Climate Action Tracker’s November 2025 update, released at COP30, places the world at (14):
- 2.6°C under current policies
- 2.6°C under the submitted 2030 and 2035 NDCs (no improvement from new pledges)
- 2.2°C if all stated targets and pledges are met
- 1.9°C under the optimistic case of full net-zero implementation across 140-plus countries
The decade has brought roughly 1°C of avoided warming relative to 2015 trajectories, which is a real and underappreciated achievement. It is also the case that the projection has barely moved in four years, and the climate verdict is where the uneven scoreboard becomes unavoidable. The decade since Paris has improved the world’s trajectory, but not enough.
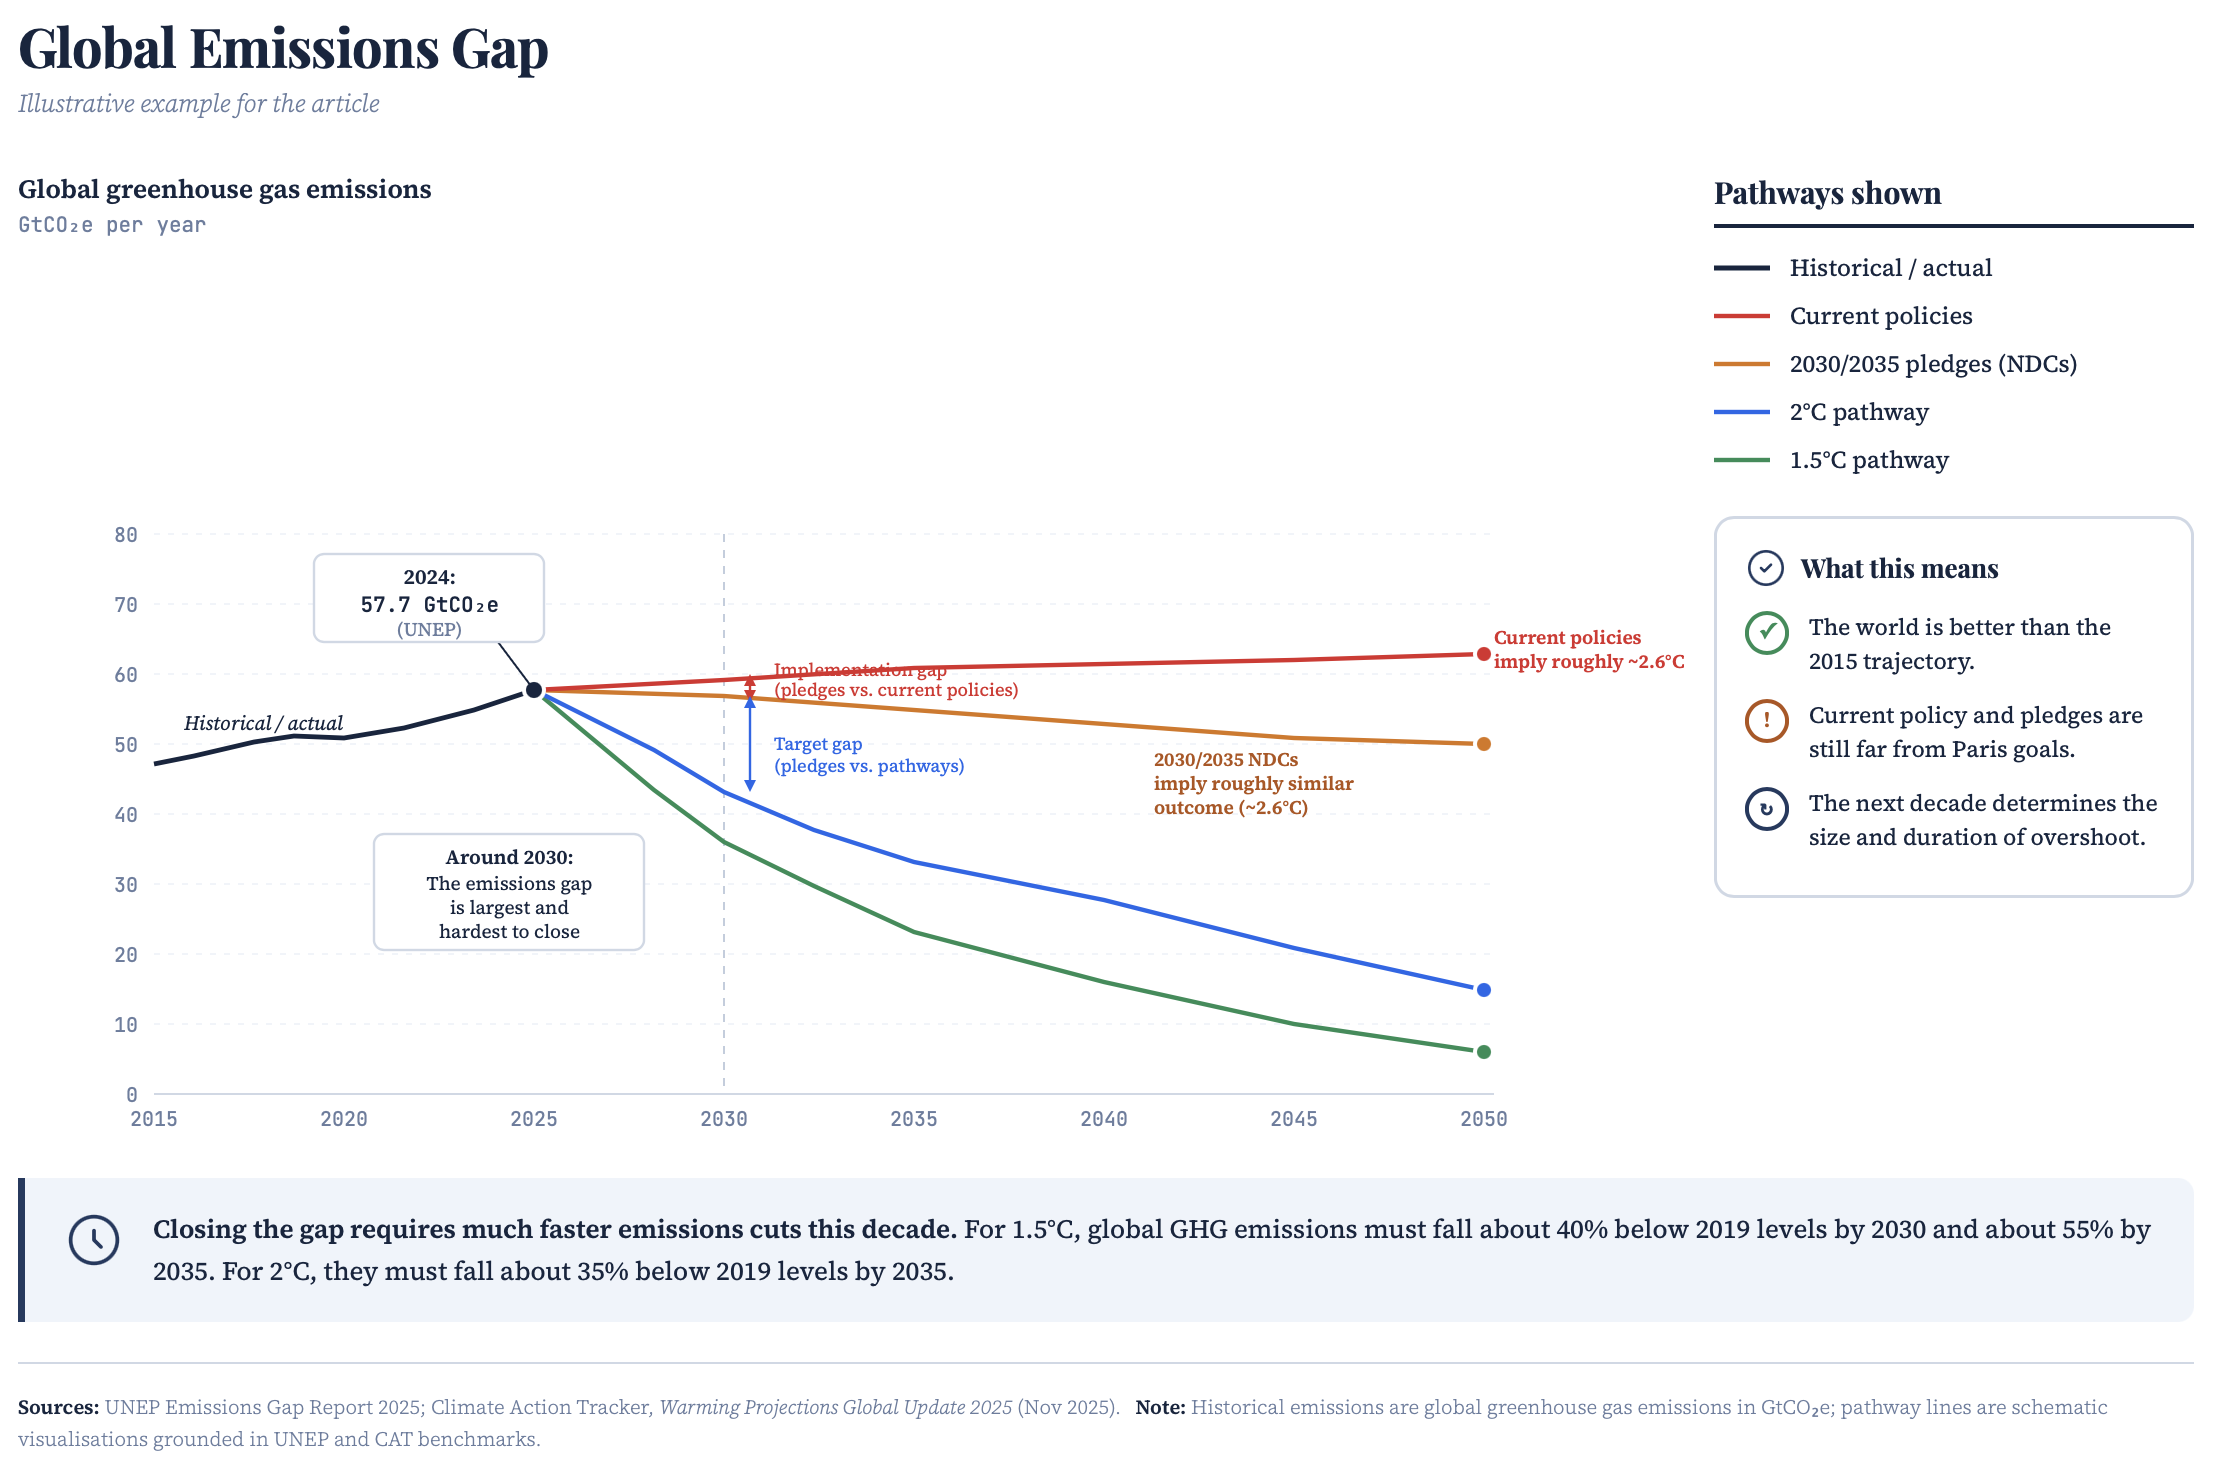
Figure 3: The global emissions gap. Current policies and submitted pledges improve substantially on the world’s 2015 trajectory, but they still leave a large gap to 2°C and an even larger gap to 1.5°C. The 2030s are where the gap becomes hardest to close.
This is the uncomfortable middle ground. The world is no longer on the pre-Paris path of around 3.6°C, which is a real achievement, but current policies still point to roughly 2.6°C, and even stated targets leave a large gap to 1.5°C. The transition has bent the curve, but not yet onto a Paris-aligned path.
UNEP’s Emissions Gap Report 2025 (13) says 2030 emissions need to fall 40% from 2019 levels to stay within 1.5°C, while current NDCs deliver perhaps 15% by 2035. The remaining carbon budget is around 170 gigatonnes, roughly four years at current rates.
Not exceeding 1.5°C is extremely unlikely, I would say. 2024 was the first calendar year above the threshold at 1.55°C; 2025 came in at 1.47°C per Copernicus C3S; the 2023–2025 average exceeded 1.5°C for the first time. (14) A single year above 1.5°C does not mean the Paris Agreement’s long-term temperature goal has formally been breached, but it does show how close the world now is to overshoot. The question is no longer whether we overshoot, but by how much and for how long. In fact, COP30 in Belém in November 2025 made this picture explicit (15). The conference produced the first-ever COP decision acknowledging a likely 1.5°C overshoot and calling to limit its magnitude and duration, but it did not produce a fossil-fuel phase-out roadmap.
So the verdict, honestly stated, is this: we have built the tools to decarbonise the electricity system and are starting to use them, but we have barely begun on everything else. As of now, the current trajectory lands at around 2.6°C, far better than the 3.6°C of 2015, but a long way from anything the Paris Agreement was meant to deliver.
Conclusion
The decade we have just lived through proves that the curve can bend dramatically when the conditions are right. The next decade is a different test, not of whether we can build solar panels, but of whether we can build grids, regulate methane, finance the global South, and decarbonise steel, cement, aviation, and shipping at anything close to the speed of the renewables story. It is a test of governance, finance, and political will. Institutional change is harder than technological change, but historically, it can move faster than people assume once the incentives line up.
The honest difficulty is that the world feels more divided on Net Zero than at any point in recent memory, not just on solutions, but on whether it remains a priority at all. Geopolitical friction, economic pressure, and active wars have pushed Net Zero down the agenda, and it is hard to argue with the logic: when people are worried about heating bills, supply chains, or physical security, a 2050 target feels abstract. Attention is a finite resource, and right now it is shifting. Forgetting tomorrow to solve today is understandable. However, forgetting tomorrow doesn’t make it go away, and it is also how you end up with two crises instead of one.
We still have a long way to go, but we must not forget all the efforts that many people have put in until now. The road is never easy, and despite everything going on in the world, it is important to keep working and keep the hope up, because that is the only way we, as a whole, have a shot at making our earth more sustainable. As always, per aspera ad astra, Massimo
A note from the author
This article has aimed to be straight to the point: how did the last ten years go, and where do we stand today? But having worked in this industry for the past eight years, I’m acutely aware of how much more there is to say. I have not tried to cover every technology, market, or political force shaping the transition. There is much more to say: on nuclear, on AI’s role in the transition, on carbon removal, and on the politics that sit behind every number in this piece. Those deserve articles of their own. I hope you’ve learned something new today, or at the very least, much like me, come away with a clearer picture of where we are and how much work still lies ahead.
A note on sources: This article is based on a range of public reports, datasets and institutional analyses, including from the IEA, IRENA, UNEP, the Global Carbon Project, Ember, BloombergNEF and others listed below. I have tried to cite the main sources behind the key figures without turning the piece into an academic paper. As this blog develops, I expect my citation style to become more consistent, but the aim here is transparency: to show where the numbers came from and make it easier for readers to check the evidence behind the argument.